
No one wants to live in an unsafe, high-crime area. That’s why it’s always a good idea to find out the crime statistics in the area where you’re considering buying or renting. So how do you do that?
One way is to look up the local police department’s crime tables. But that’s next to useless, for several reasons. First, it’s not easy to tell what specific area you’re looking at. For example, here in Miami, you have the City of Miami, as well as Miami-Dade County, and many other cities, like Coral Gables, South Miami, and Miami Beach.
Second, looking at a bunch of numbers may not be very useful. If you know that there were, say, 10,000 assaults in Los Angeles last year, what does that tell you? Is that a lot, is that a little? How do you even define “assault” versus, for example, “battery”?
Credit: Giphy
It’s one big mess, unless you use a tool that makes the data easy to see and analyze. Enter Trulia Maps, the best way to find a crime map and neighborhood crime statistics.
What It Is
Trulia is a real estate listing website, kind of like Zillow. But the genius feature I’m talking about here is its maps, which show crime statistics in a color-coded overlay map of cities. This lets you see relative crime levels for different city areas, block-by-block. Of course, it’s only as good as the crime statistics reporting it feeds on, but it’s still mega-useful.
How It Works
Update: This keeps getting harder to find. The best way I’ve found is by Googling “Trulia [city] [state] real estate market overview”. Then, go to the market overview result on Trulia.
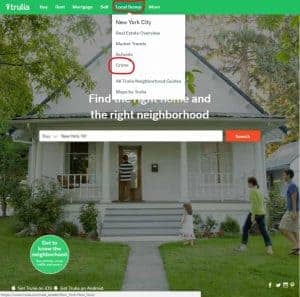
You can find it by either Googling something like “trulia crime map Los Angeles”, or by first going to the Trulia website and then choosing a particular city. Then, go to “Local Scoop” and then “Crime”:
Click on “Crime” within “Local Scoop”
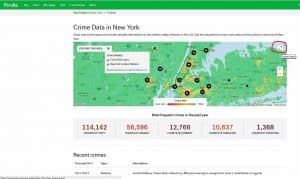
New York City
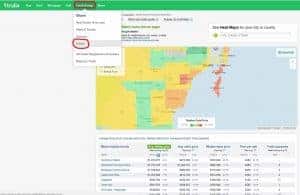
This will then bring up the legendary maps, within a page of statistics. There, I recommend you expand the map, like so:
Click on the circled icon.
Once expanded, you can just zoom in to the location you’re considering, in order to compare it with other neighborhoods (or even blocks). Take a look at a few examples:
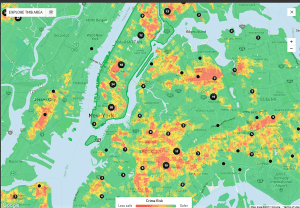
NYC, medium zoom. Beware those red zones!
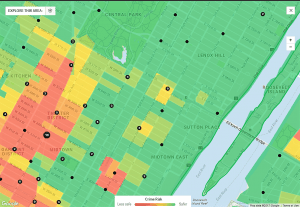
NYC, block by block.
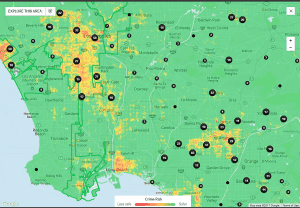
Los Angeles. Most of it looks pretty safe.
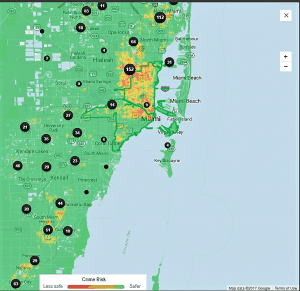
The Magic City (Miami). Not bad!
Bottom Line
So there you have it, dear readers. Crime and safety data, in a format that’s actually useful and easy to read.

Fascinating! Such a great way to use statistics too like that – love it. Great tip, thank you 🙂
Thanks! It was really useful to me when house-hunting.
That is an awesome tip!
You said something that bears repeating: it’s only as good as the crime statistic reporting it feeds on.
Many years ago, a local TV station reported on how crime-ridden my city was compared with the neighboring city. (Our city was in a “donut hole”, basically surrounded by a larger city and officially part of the unincorporated area of the county.) Turns out the county PD statistics were being scraped by this website, but the stats for the surrounding city were not. At first blush, my area was a ghetto war zone. So it pays to dig deeper into the stats if you’re using the information for a major purchase or move!
Thanks! What I like about the maps is that they show you relative crime levels. That way, you known which neighborhoods are safer, compared to others in the same city.